
Cottonwood, AZ population between 2000 and 2023
Over the last 20 plus years, between 2000 and 2023, population of Cottonwood increased by 3,471. In this period, the peak population was 13,124 in the year 2023. The numbers suggest that the population has not reached its peak yet and is showing a trend of further growth.
| Year | Population | Year on Year Change | Change in Percent |
|---|---|---|---|
| 2000 | 9,653 | – | – |
| 2001 | 10,051 | 398 | 4.12% |
| 2002 | 10,355 | 304 | 3.02% |
| 2003 | 10,456 | 101 | 0.98% |
| 2004 | 10,641 | 185 | 1.77% |
| 2005 | 11,111 | 470 | 4.42% |
| 2006 | 11,372 | 261 | 2.35% |
| 2007 | 11,514 | 142 | 1.25% |
| 2008 | 11,634 | 120 | 1.04% |
| 2009 | 11,591 | -43 | -0.37% |
| 2010 | 11,160 | -431 | -3.72% |
| 2011 | 11,126 | -34 | -0.30% |
| 2012 | 11,147 | 21 | 0.19% |
| 2013 | 11,252 | 105 | 0.94% |
| 2014 | 11,425 | 173 | 1.54% |
| 2015 | 11,573 | 148 | 1.30% |
| 2016 | 11,857 | 284 | 2.45% |
| 2017 | 11,996 | 139 | 1.17% |
| 2018 | 12,191 | 195 | 1.63% |
| 2019 | 12,321 | 130 | 1.07% |
| 2020 | 12,219 | -102 | -0.83% |
| 2021 | 12,443 | 224 | 1.83% |
| 2022 | 12,940 | 497 | 3.99% |
| 2023 | 13,124 | 184 | 1.42% |
Source: Cottonwood, AZ Population by Year – 2024 Update | Neilsberg
Camp Verde, AZ population between 2000 and 2023
Over the last 20 plus years, between 2000 and 2023, population of Camp Verde increased by 3,015. In this period, the peak population was 12,489 in the year 2023. The numbers suggest that the population has not reached its peak yet and is showing a trend of further growth.
| Year | Population | Year on Year Change | Change in Percent |
|---|---|---|---|
| 2000 | 9,474 | – | – |
| 2001 | 9,582 | 108 | 1.14% |
| 2002 | 9,715 | 133 | 1.39% |
| 2003 | 9,864 | 149 | 1.53% |
| 2004 | 10,009 | 145 | 1.47% |
| 2005 | 10,149 | 140 | 1.40% |
| 2006 | 10,593 | 444 | 4.37% |
| 2007 | 10,822 | 229 | 2.16% |
| 2008 | 10,881 | 59 | 0.55% |
| 2009 | 10,838 | -43 | -0.40% |
| 2010 | 10,870 | 32 | 0.30% |
| 2011 | 10,904 | 34 | 0.31% |
| 2012 | 10,899 | -5 | -0.05% |
| 2013 | 10,989 | 90 | 0.83% |
| 2014 | 11,064 | 75 | 0.68% |
| 2015 | 11,132 | 68 | 0.61% |
| 2016 | 11,206 | 74 | 0.66% |
| 2017 | 11,222 | 16 | 0.14% |
| 2018 | 11,262 | 40 | 0.36% |
| 2019 | 11,224 | -38 | -0.34% |
| 2020 | 12,170 | 946 | 8.43% |
| 2021 | 12,316 | 146 | 1.20% |
| 2022 | 12,446 | 130 | 1.06% |
| 2023 | 12,489 | 43 | 0.35% |
Source: Camp Verde, AZ Population by Year – 2024 Update | Neilsberg
Connecting the Dots: Population, Census Data, Government Growth, and Taxes
My initial focus was on the timeline when the City of Sedona began to prioritize tourism. This shift involved placing a non-governmental entity, a regional business association, in a pivotal role, allowing them to guide the city council and receive annual funding without any performance metrics. The city asserted that they were unable to handle the task on their own, labeling this group as the experts while ignoring state tourism policies.
Discover more through information that is grounded in facts and data.
I began with the population data for Sedona, utilizing two reliable sources: Neilsberg and Census figures. City of Sedona Population Growth – Donna Joy
Utilizing same two reliable sources: Neilsberg and Census figures I expanded to include nearby municipalities, The City of Cottonwood and the Town of Camp Verde Population Sedona Area Cities – Towns – Donna Joy
Then I moved on to more census numbers for all three locations. Communities are always evolving, and understanding these changes can provide valuable insights. By examining census data, we can learn more about our identities, discover which communities are expanding, and explore the differences and transformations within these communities. A view of Sedona area communities 2023 Census – Donna Joy
What unique actions has the City of Sedona taken that set it apart from the City of Cottonwood and the Town of Camp Verde?
In 2013, the City of Sedona increased the sales tax and established a no-bid contract with the regional Sedona Chamber of Commerce. This agreement allocated 55% of the city’s bed taxes without restrictions to the Chamber and its members.
The City of Sedona has invested millions of public funds into an NGO that purports to function as a Tourism Bureau. However, the membership distribution of the Sedona Chamber of Commerce largely extends beyond the city limits and is not limited to the tourism sector. This investment was made without any restriction’s contracts of assets on the use of public money.
Tourism has not seen any improvement under the tourism-first agenda, and the situation for residents has remained stagnant.
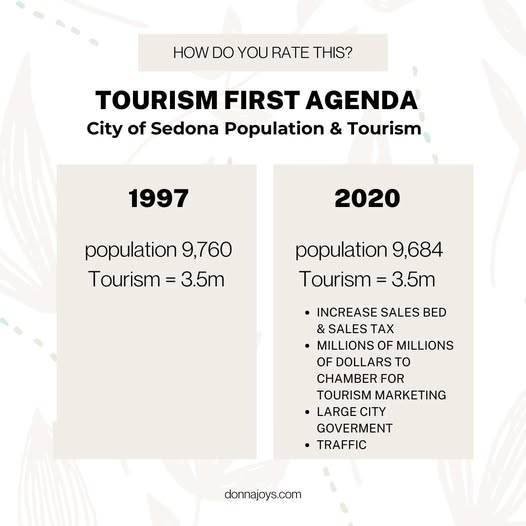
Tourism First Agenda
City of Sedona Population & Tourism
1997-population 9,760 Tourism = 3.5m
2020-population 9,684 Tourism = 3.5m
Source: Sedona Community Profiles
In 2017, the Sedona City Council approved a new “Sunset” half-cent sales tax with a vote of 6-1. This revenue was earmarked to fund approximately $35 million in traffic mitigation construction over the following decade. In 2021, the City Council transitioned this sunset tax into a permanent sales tax increase.
What’s next?
more to come…….
What factors have contributed to Sedona’s politically charged atmosphere due to the tourism-first agenda and how has the unrestricted public funding provided to an NGO- Sedona Chamber of Commerce changed Sedona?
Posts on City issues:
The City of Sedona is still hiding information when they have the ability to make the public. The city’s need to hide information makes it more…
When I moved here over 30 years ago Sedona had a good small government until they didn’t. We could always attend Sedona City Council meetings, write…
Do Census Numbers Illuminate the Sedona Area Communities? Communities are always evolving, and understanding these changes can provide valuable insights. By examining census data, we can…
The misuse of incorrect City of Sedona population has been used to push the city community plan and projects through using incorrect numbers, claiming we need…
Learn more about the Department of Organizational Performance City of Glendale, Arizona and how using science, technology, engineering, and mathematics
What Works Cities for Local governments? Quality management programs, that improve and engage residents through data-driven analysis
Join the conversation, learn more about Sedona Politics Sedona Politics in Motion Bulletin Board | Facebook

Donna Joy ~
A retired Entrepeneur, Creator, Business owner, Culinary Artist, Chef & Chief Operating Disruptor.
♥ Donna Joy
donna@donnajoys.com